Control Plane Graph Intelligence
Atulya's Control Plane now helps teams understand a memory bank as a living system, not just a list of stored items.
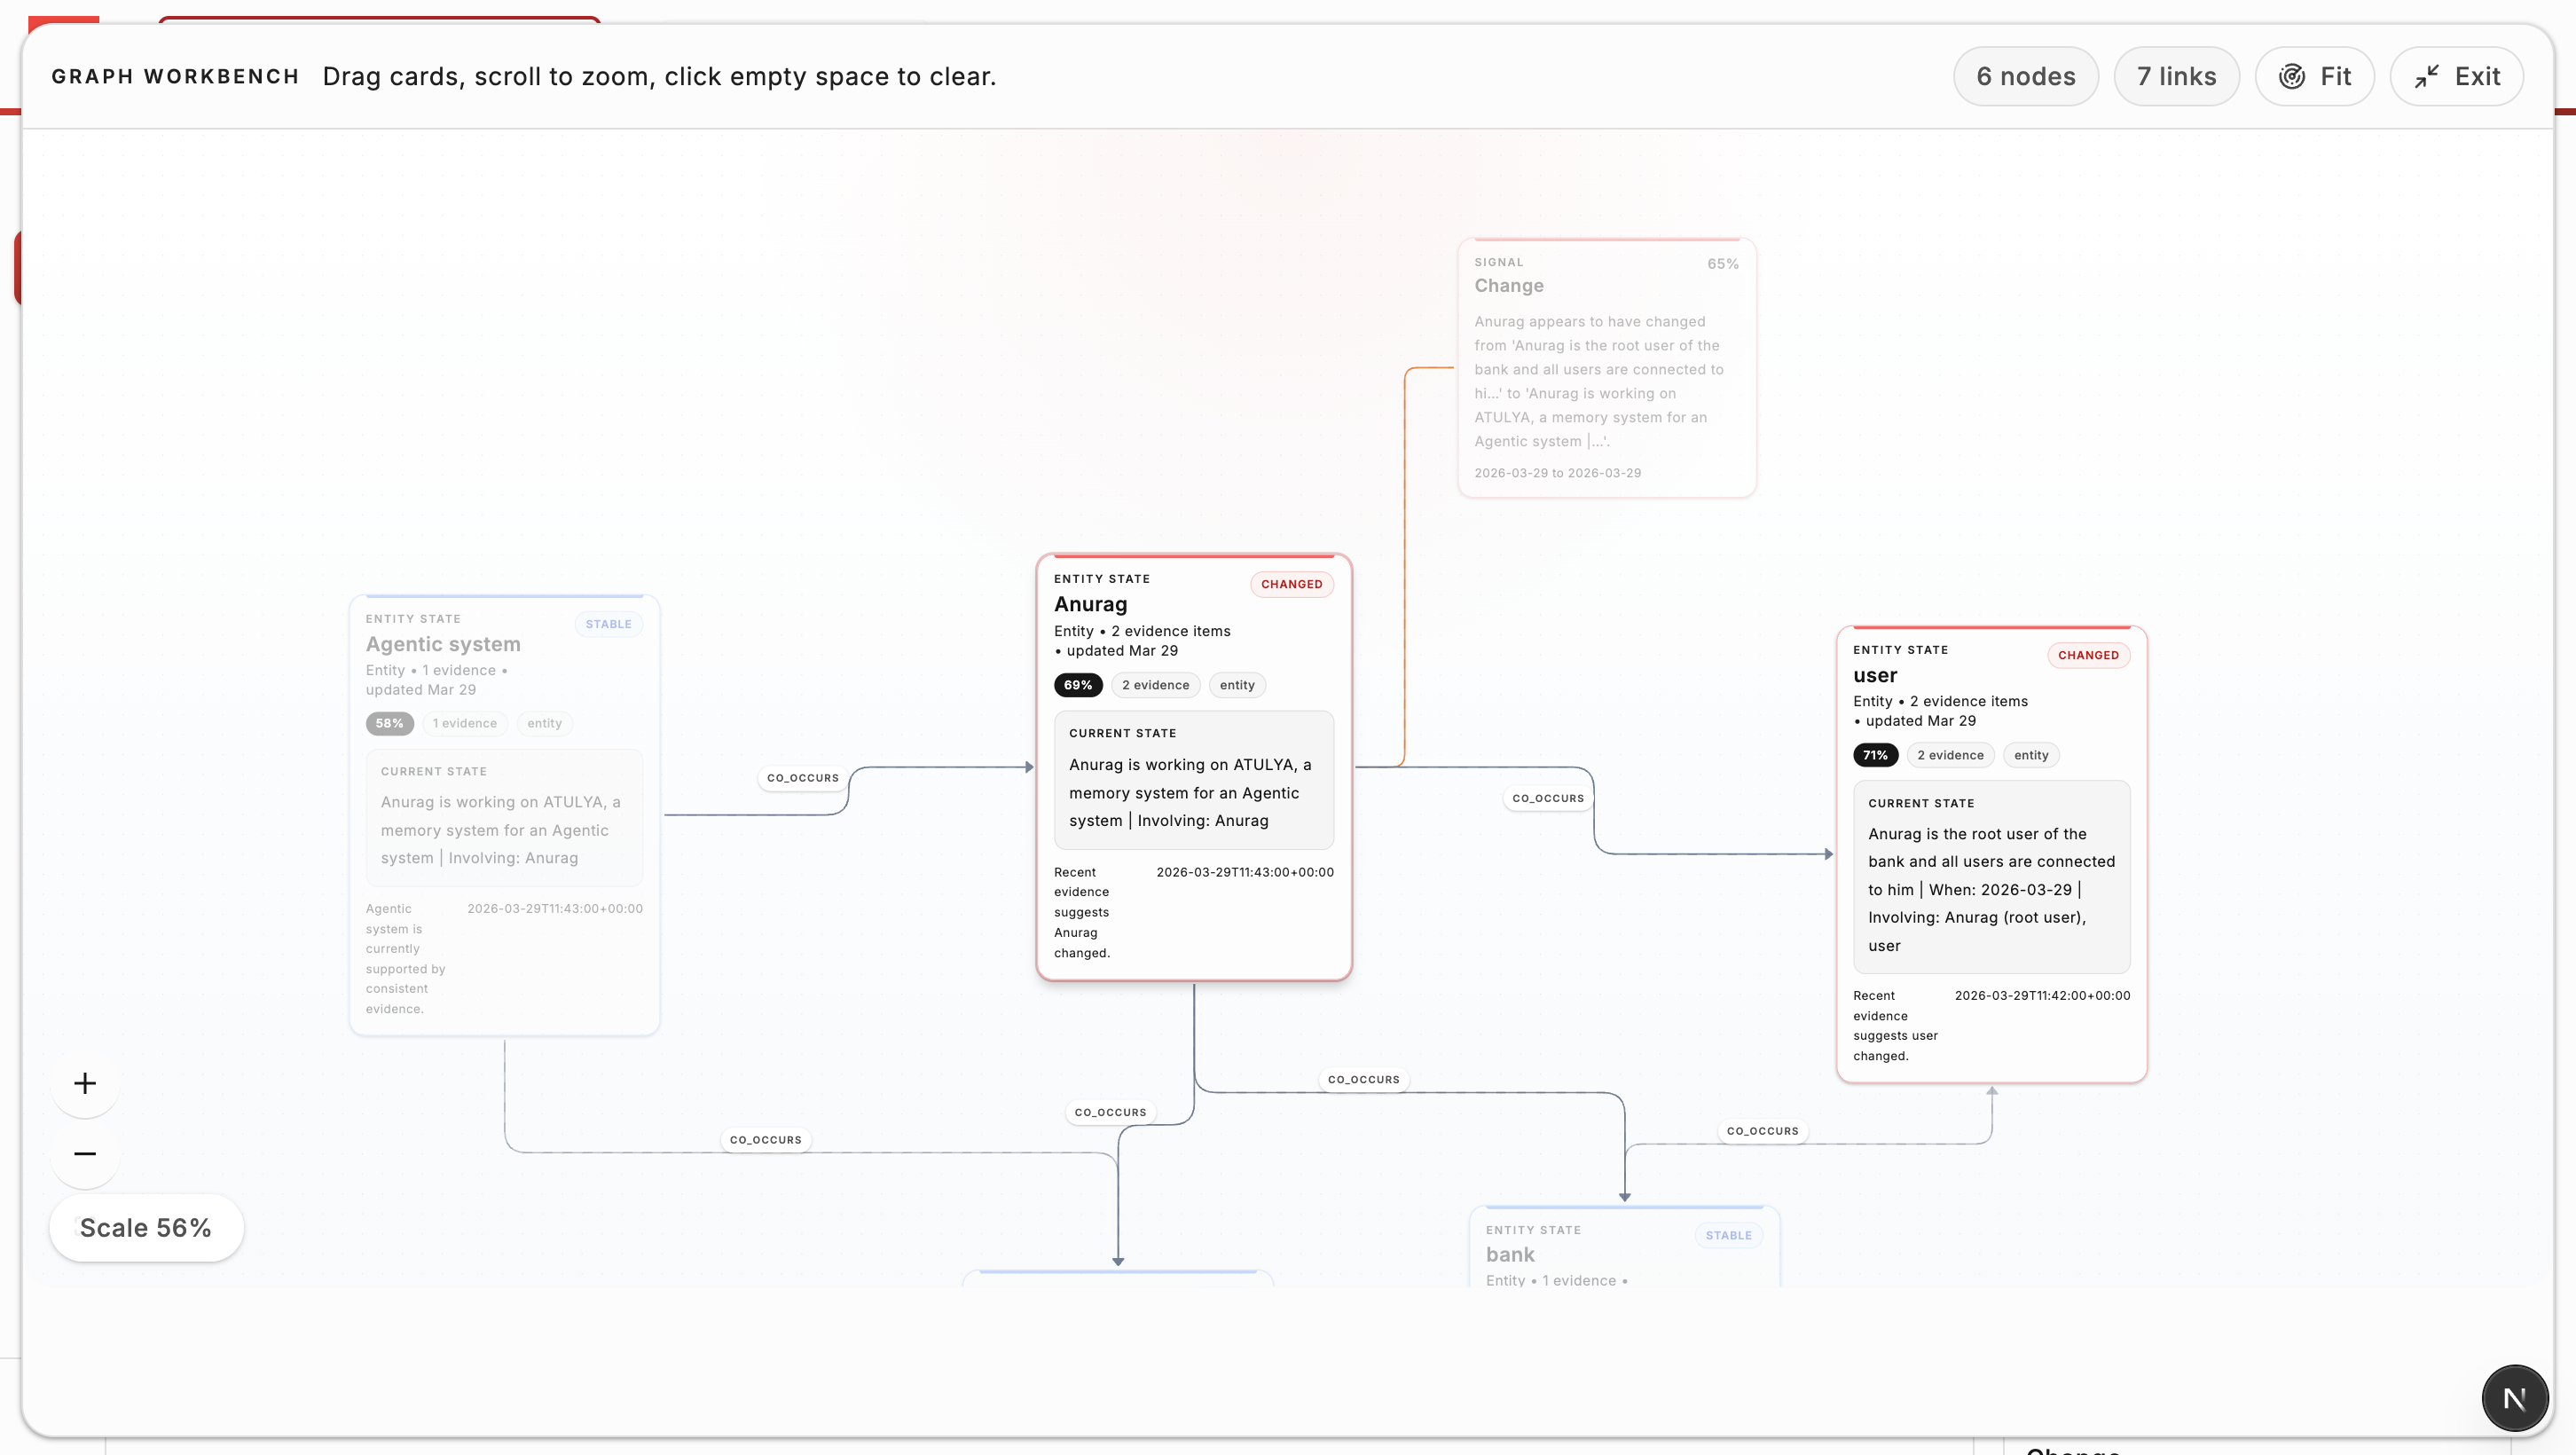
The main question this feature answers is simple:
What changed, why does Atulya think that, and what should I inspect next?
This is useful for support teams, ops teams, knowledge teams, and anyone who needs to review evolving memory without manually tracing every raw fact.
What You Get
Graph Intelligence adds two connected views:
- State Graph shows the current state of important entities and topics.
- Evidence Graph shows the raw memories and links behind that state.
Together, they let a human move from:
- a high-level summary
- to a focused graph
- to the exact evidence behind it
The Fast Mental Model
If you only remember one thing, remember this:
- State Graph tells you the story.
- Evidence Graph shows you the proof.
- The graph assistant helps you move between the two without getting lost.
Words We Use In This Page
To keep the docs easy to scan, we use the same words everywhere:
| Term | Meaning |
|---|---|
| State | The current view of a topic or entity |
| Evidence | The raw memory items behind that state |
| Proof | The exact evidence path that supports an answer |
| Focus area | The small part of the graph you are reviewing right now |
| Filter | A way to show less noise (for example, anomaly-only nodes) |
| If you want to... | Start here | Why |
|---|---|---|
| Understand what changed | State Graph | It starts with meaning, not noise |
| Check whether something is still true | State Graph | It highlights changed, stale, and conflicting state |
| Verify the raw source | Evidence Graph | It shows the actual memories and links |
| Explain a conclusion to another person | Analyst answer + Evidence Graph | You get the short answer and the supporting path |
Why This Replaces the Old Graph
The older raw node-link graph was useful for debugging, but primitive for real operational use.
It forced humans to read a dense network of low-level memories and infer the story themselves.
The new model is more useful because it starts with meaning:
- show important state instead of every raw memory first
- highlight changes, contradictions, and stale assumptions
- explain why Atulya believes something
- let the user open proof only when needed
The raw graph still exists, but it is now a supporting investigation tool instead of the default landing view.
The Two Main Views
State Graph
Use State Graph when you want to understand the bank quickly.
It emphasizes:
- what changed recently
- which entities or topics matter most
- where evidence conflicts
- which states may be stale
Each card is designed to be readable in plain language, with confidence, evidence count, and a short explanation of the current state.
Typical questions:
- What changed about this customer, repo, or workflow?
- Which belief is now outdated?
- Where do we have conflicting evidence?
| State Graph helps with... | What the user sees |
|---|---|
| Recent change | A state card and change signal |
| Contradiction | Evidence that does not agree |
| Stale understanding | A belief that has not been refreshed while related signals moved |
| Priority | The most important entities or topics first |
Evidence Graph
Use Evidence Graph when you need proof.
It shows the underlying memories, connections, and supporting paths behind a state or answer.
Typical questions:
- Which raw memories support this conclusion?
- Which document or chunk introduced this belief?
- How are these two memories connected?
| Evidence Graph helps with... | What the user sees |
|---|---|
| Raw proof | Memory cards and their links |
| Provenance | Which memory, chunk, or document supports a conclusion |
| Connection tracing | How one memory led to another |
| Human review | The exact path behind a state or analyst answer |
New Controls for Faster Human Review
The latest graph update focuses on simple controls that reduce clutter without hiding useful information.
Right-click node menu
Right-clicking a node opens quick actions. This lets users focus the graph without opening multiple panels first.
| Surface | Right-click actions |
|---|---|
| State Graph node | Focus neighbors, filter to entity/topic, reset filters |
| Evidence Graph node | Focus node, show connected focus area, anomaly-only view, clear focus, reset filters |
Anomaly-focused review
Evidence Graph now includes anomaly review controls so teams can quickly inspect risky areas.
| Control | What it does |
|---|---|
| Filter Anomalies | Shows only nodes linked to anomaly events |
| Severity Overlay | Colors nodes by highest anomaly severity |
| Top anomaly type chips | Shows the most common anomaly categories in the current result |
Link meaning improvements
Links are still grouped into semantic, temporal, entity, and causal, but causal links now keep their subtype meaning.
| Link type | Color in UI |
|---|---|
semantic | red |
temporal | dark red |
entity | amber |
causes | violet |
caused_by | indigo |
enables | green |
prevents | red |
A Simple Human Workflow
The intended flow is:
- Open a memory bank.
- Start in State Graph to see the important changes.
- Ask the graph assistant a question such as
What changed about X? - Inspect the answer and the focused subgraph.
- Open Evidence Graph when you want the raw proof.
This keeps the experience text-first and human-readable, while still keeping proof easy to verify.
| Step | What Atulya is doing for the human |
|---|---|
| Open bank | Surfaces the most useful state first |
| Ask a question | Narrows the graph to the relevant part |
| Inspect answer | Explains what changed in plain language |
| Open evidence | Lets you verify the proof without losing context |
Built for Large Banks
Graph Intelligence is designed to scale without turning the browser into a wall of cards.
For larger banks, the Control Plane uses progressive exploration instead of trying to render everything at once.
Detail Mode
For smaller focus areas, Atulya shows full cards and rich interaction.
Compact Mode
For medium-sized focus areas, cards become lighter and more condensed.
Overview Mode
For larger graphs, Atulya switches to an overview that summarizes the bank using:
- clusters
- bundled paths
- top-use memories
- top-use chunks
- focused area expansion
This is important because the goal is not "show every node." The goal is "help a human understand the bank quickly."
| Graph size | What Atulya does | Why it helps |
|---|---|---|
| Small | Shows rich cards directly | Full detail is still easy to read |
| Medium | Uses lighter cards | Keeps the canvas readable |
| Large | Starts with an overview | Avoids turning the browser into a wall of boxes |
| Very large | Expands only the useful focus area | Keeps the experience fast and understandable |
What the Analyst Layer Adds
The graph is not just a visual renderer.
Atulya also builds a read model that lifts raw memory evidence into higher-level state:
- stable state
- changed state
- contradictory state
- stale state
The graph assistant then returns:
- a short answer
- the focused nodes and edges
- change events
- an evidence path
- recommended checks
That is what makes the feature useful in industry: the graph is connected to explanation, not just drawing.
| Analyst output | What it means in plain language |
|---|---|
answer | The short human-readable conclusion |
focal_node_ids / focal_edge_ids | Which part of the graph matters for this question |
change_events | What changed, conflicted, or went stale |
evidence_path | The proof trail behind the answer |
recommended_checks | What a human may want to review next |
API Surfaces Behind the UI
The Control Plane is backed by dedicated graph endpoints:
GET /v1/default/banks/{bank_id}/graph/intelligencePOST /v1/default/banks/{bank_id}/graph/investigateGET /v1/default/banks/{bank_id}/graph/summaryGET /v1/default/banks/{bank_id}/graph/neighborhoodPOST /v1/default/banks/{bank_id}/anomaly/intelligence
The first two power the meaning-first workflow:
- build the state graph
- investigate a change or question
The second two support scaling:
- summarize large graphs
- expand a focused area without loading the whole bank into the canvas
| Endpoint | What it is for |
|---|---|
GET /graph/intelligence | Build the meaning-first state graph |
POST /graph/investigate | Ask a question and get a focused answer |
GET /graph/summary | Summarize a large graph into a readable overview |
GET /graph/neighborhood | Load the focus area a human actually needs |
POST /anomaly/intelligence | Fetch anomaly events and correction history for overlays and filters |
Good Use Cases
This feature is especially useful when a memory bank represents:
- customer history
- product operations
- support cases
- engineering incidents
- personal knowledge that evolves over time
- shared team memory across tools and conversations
In each of these cases, a human usually does not want a primitive raw graph first.
They want:
- the story
- the proof
- the next thing to check
| Real use case | Why Graph Intelligence helps |
|---|---|
| Support operations | See what changed about a customer or incident before reading every note |
| Product operations | Track shifts in issues, requests, and state over time |
| Engineering incidents | Move from a summary of change to the exact evidence trail |
| Shared team memory | Understand evolving knowledge without reading every raw memory |
| Personal knowledge banks | Review how beliefs and facts changed over time |